Composite TL Calculator Settings#
1/3 Octaves and 1/1 Octaves#
Single octave band (1/1) and one-third octave band (1/3) tabs are available in the Composite TL Calculator.
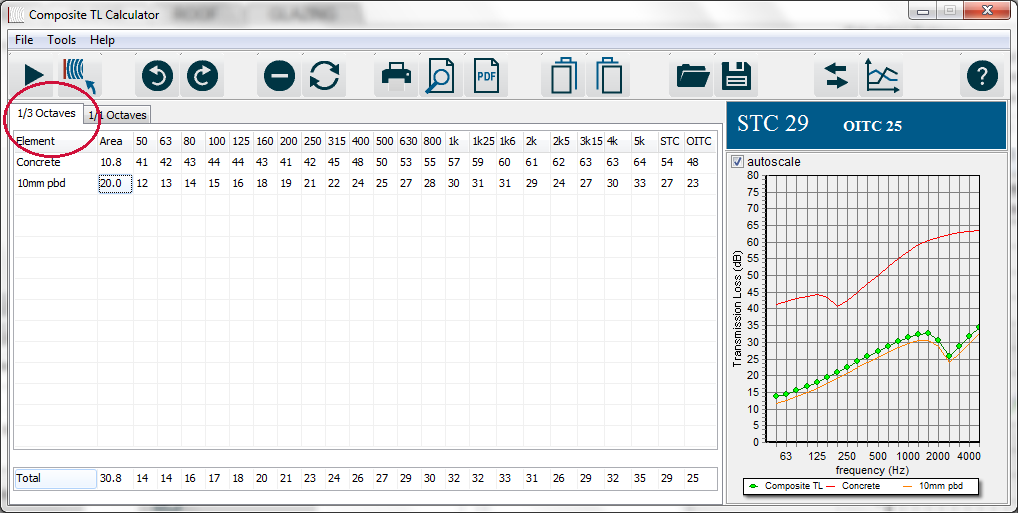
- Transmission loss data added to the Composite TL Calculator from INSUL will be added in 1/3 octave bands.
- Data added to the 1/3 Octave tab is converted by the Composite TL Calculator into octave band data which is displayed on the 1/1 Octave tab.
-
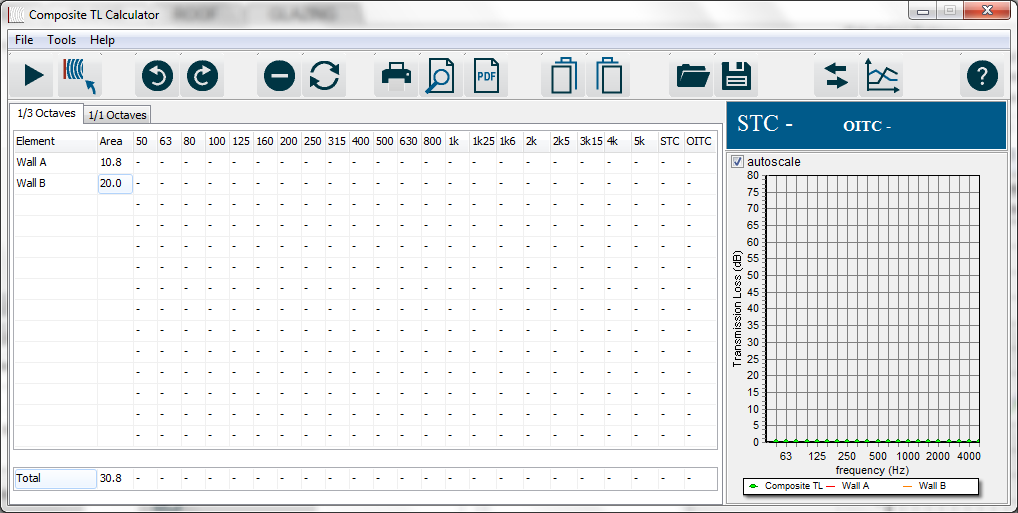
Data added to the 1/1 Octave tab cannot be converted into 1/3 octave data. When values are manually entered into the 1/1 Octave tab, the 1/3 Octave tab will be zeroed and will appear as follows:
Undo, Redo#
To Undo an action, either:
- Click

- Press Ctrl+z
- From the Tools menu, select: Tools > Undo
To Redo an action that has been undone either:
- Click

- Press Ctrl+y
- From the Tools menu, select: Tools > Redo
Delete data#
To delete a row, either:
- Click

- Press F6
- From the Tools menu, select: Tools > Delete a line
The row which contains the selected cell will be deleted and all values in that row will be set to zero.
Reset calculator#
To reset the Composite TL Calculator and clear all data, either:
- Click

- Press F12
- From the Tools menu, select: Tools < Reset
Printing#
A sheet can be printed which records each set of transmission loss data in the Composite TL Calculator including the composite transmission loss. There are 3 buttons associated with printing:
- The first button,
 , when clicked will display a print dialog box which enables the user to do the usual selection of printer properties etc before sending the page to the printer.
 - The second button,
 , displays a preview of what will be printed. Due to the generally poorer resolution of screens compared to printers, this will not look exactly the same as the printout.
 - The third button,
 , will generate an PDF file of the printout. This is a fairly universal format that enables, for instance, the user to email printouts to others. The receiver will require a PDF viewer to view the file.
Copy#
To copy a single cell or a range of selected cells, press Ctrl+c
This will copy the selected cell(s) to the Clipboard.
Copy selected row#
For the row of a selected cell, to copy the entire row to the Clipboard click 
Where all 1/3 or 1/1 Octave data is copied, the 1/3 or 1/1 Octave band centre frequencies and STC/Rw values are also copied.
Paste#
To paste data from the Windows clipboard into the Composite TL Calculator, select the cell on either the 1/3 Octave or 1/1 Octave tabs and either:
- Click the
 button
 - Press Ctrl+v
- From the Tools menu, select: Tools > Paste
The selected cell will contain the top left-hand item of the data on the clipboard.
Save#
It is possible to save composite transmission loss data for future reference. To save a file, either:
- Click the
 button on the INSUL Toolbar
 - Press Ctrl+s
- From the File menu, select: File > Save
This will open a Windows file dialog box. Click in the filename box and enter the name the file is to be saved as. To change to a different directory use the standard windows file directory tree to navigate to the desired directory. If a file extension is not included in the filename, the file will be saved as a .cns INSUL file.
Open#
You may open/recall/load a file at a later stage. To open a file, either:
- Click the
 button
 - Press Ctrl+o
- From the File menu select: File > Open
This will bring up a file dialog box. This works similarly to other windows programs. For instance, you can double-click on the file you wish to recall or type its name into the edit box.
Toggle STC/Rw#
To toggle between STC and Rw single figure indices, either:
- Click the
 button
 - From the Tools menu, select: Tools > Toggle STC/Rw
Show/Hide plots#
To show/hide element plots, either:
- Click the
 button
 - Click on the chart
- Press F4
- From the Tools menu, select: Tools > Show/hide element plots
When the element plots are shown, the chart displays a plot for each set of transmission loss data that is entered into the Composite TL Calculator. A different line colour is used for each set of data. An example of composite transmission loss calculation with element plots shown is provided in the image below.
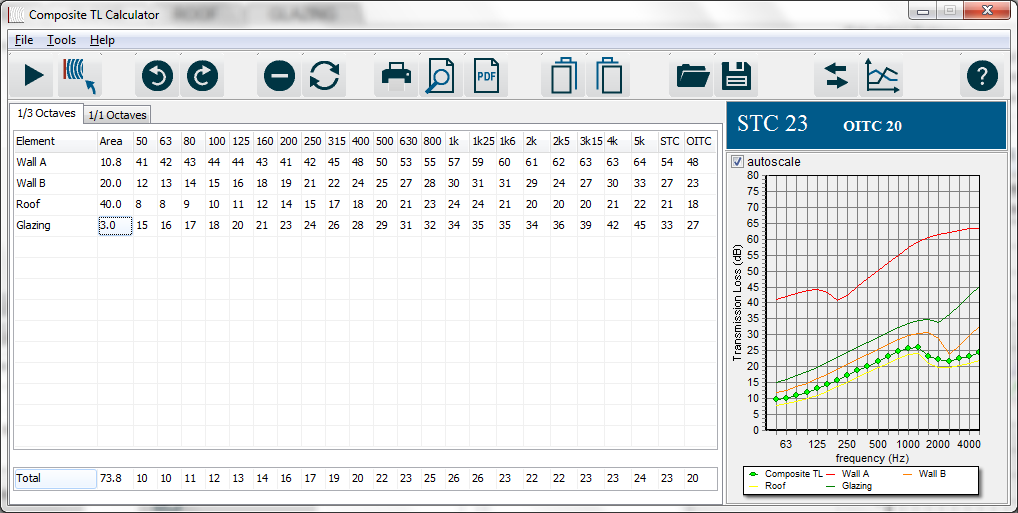
When the element plots are hidden, the chart displays only the Composite TL data plotted as a green curve.