Charts & Tables#
Summary results for an INSUL model are provided above the INSUL Illustration as an octave band table and an overall index value such as, for example, STC, Rw, IIC and dBA.
More detailed model results are presented in the INSUL Charts and Table, in the lower right-hand section of the INSUL window.

INSUL Chart#
The INSUL Chart, as shown above, displays predicted sound levels in one-third octave bands:
Reference spectra can be added to the chart using the INSUL Table, as described below:
- To set a comparison spectra click one of the Comparison buttons,
 or
or 
- The INSUL Chart can be copied to the clipboard by clicking

- Auto-scaling can be toggled on and off using the Auto Scale checkbox

- A curve indicating the flanking limits associated with the model can be toggled on and off using the Show Flanking Limit checkbox

Chart Legend
The INSUL Chart includes a legend which displays the name of each curve shown on the chart and, where applicable, its single figure index (STC/Rw, Ln,w/IIC, dBA/NR/NC/PNC)
Table#
The INSUL Table displays predicted one-third octave band sound levels in tabular form.

Reference spectra can be added to the INSUL Table for display on the INSUL Chart.
Data can be copied and pasted to and from the Table.
- Click
 to copy a selected range of cells from the Table
 - Click
 to paste data into the Table
 - Reference spectra data can also be typed into the INSUL Table directly
Floor Cover Chart#
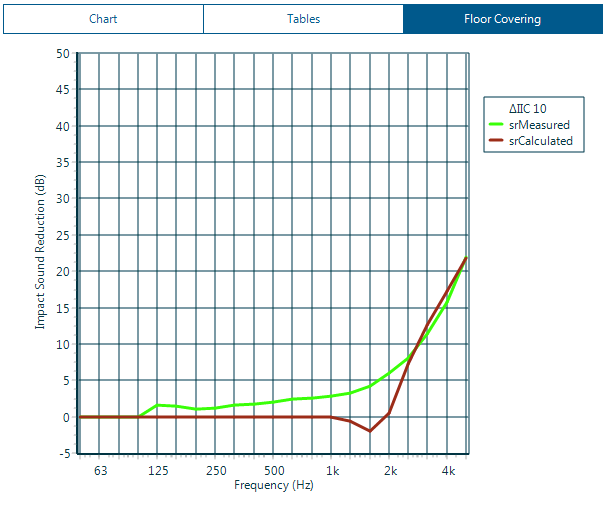
If the Floor tab is selected from the INSUL Construction Tabs, then INSUL Charts & Table panel includes a Floor Cover Chart, which presents one-third octave band data for the reduction in impact sound pressure levels from the floor cover selected in the Floor Cover Products list.